Em'otion Photo
Bien plus que des photos, des émotions...
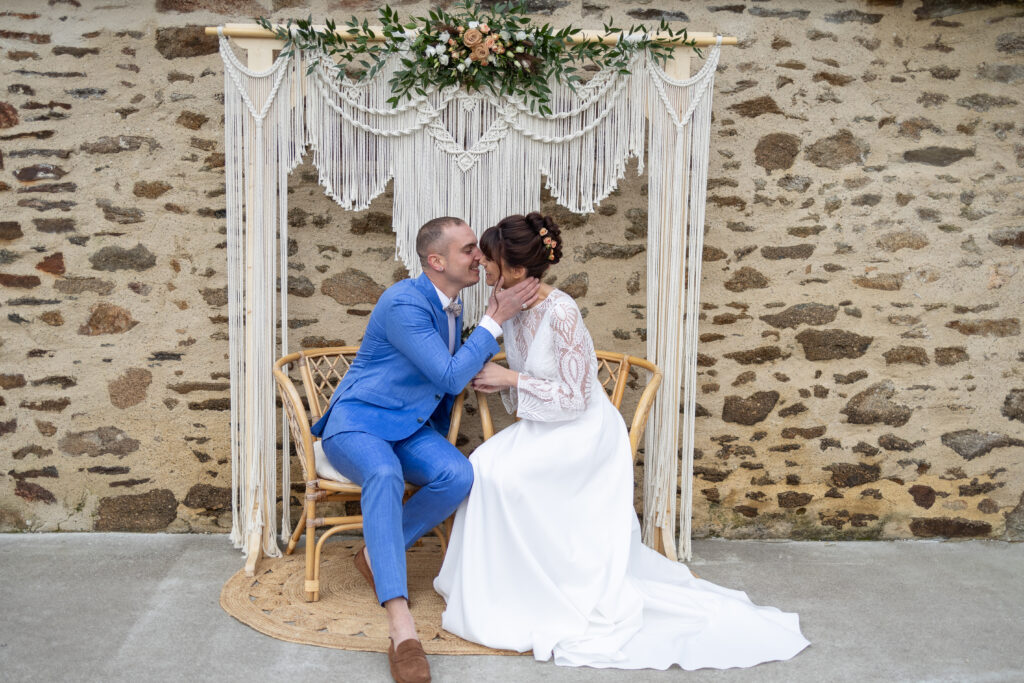
Je vous accompagne pour un reportage photo de votre mariage qui raconte en image les émotions, les moments intenses et les détails délicats de ce grand jour.
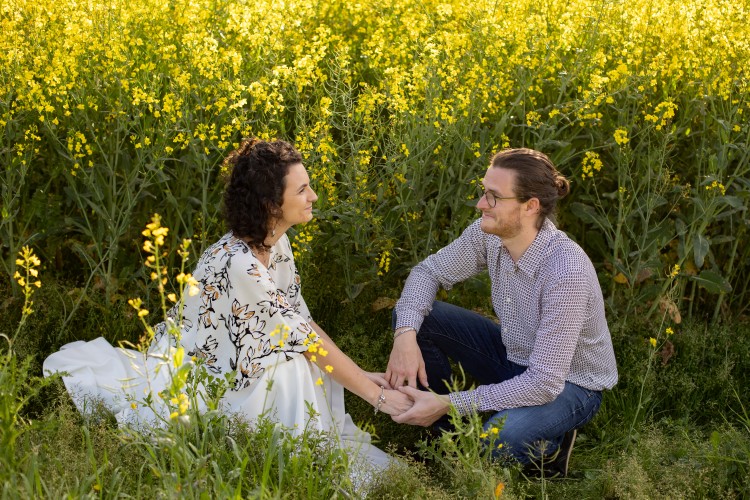
Que vous soyez jeunes amoureux ou mariés depuis des années, venez partager plus qu’une séance photo, un moment hors du temps pour vous retrouver à deux et sublimer vos sentiments !
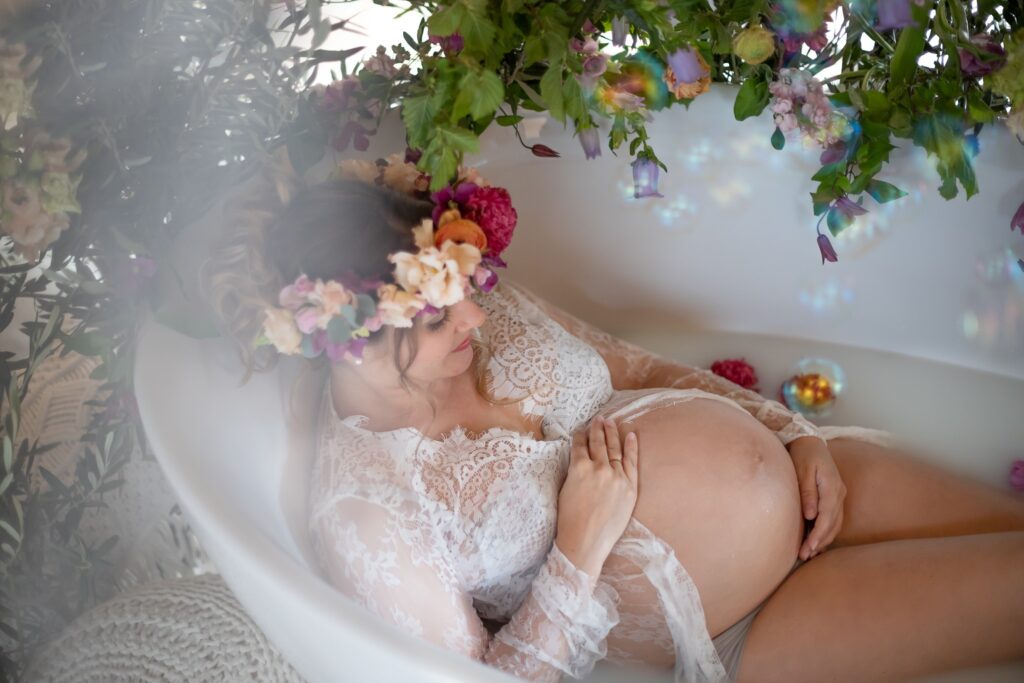
La séance photo grossesse (naturelle ou artistique) est l’occasion de sublimer l’attente de votre enfant et de raconter en image tout l’amour que vous ressentez pour lui.
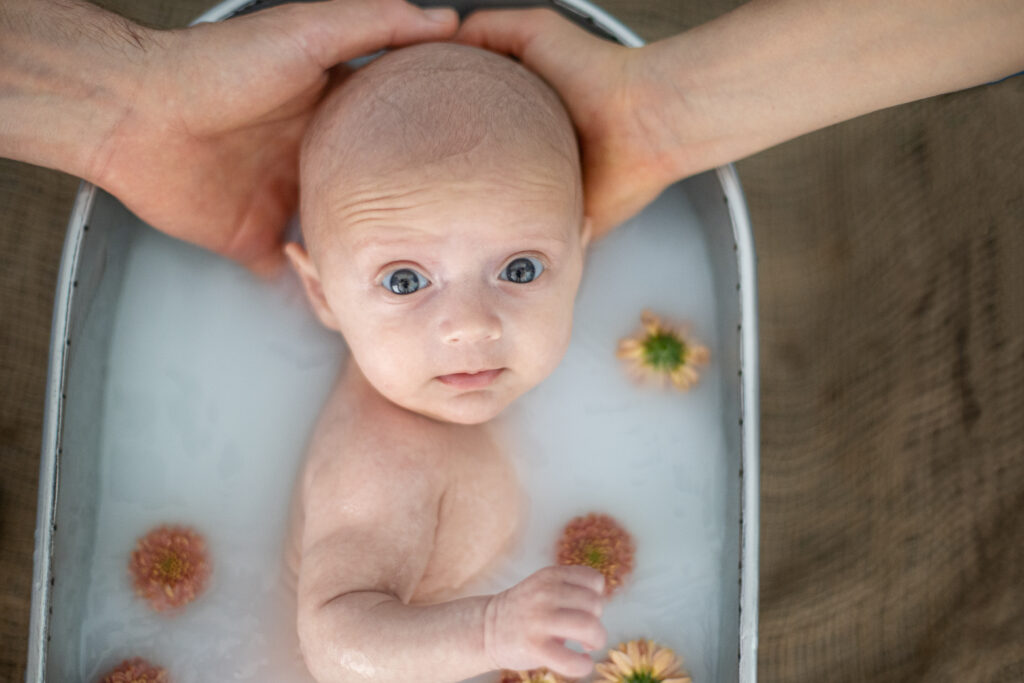
Une expérience photo nouveau-né, c’est un temps d’Amour et de tendresse avec votre bébé.
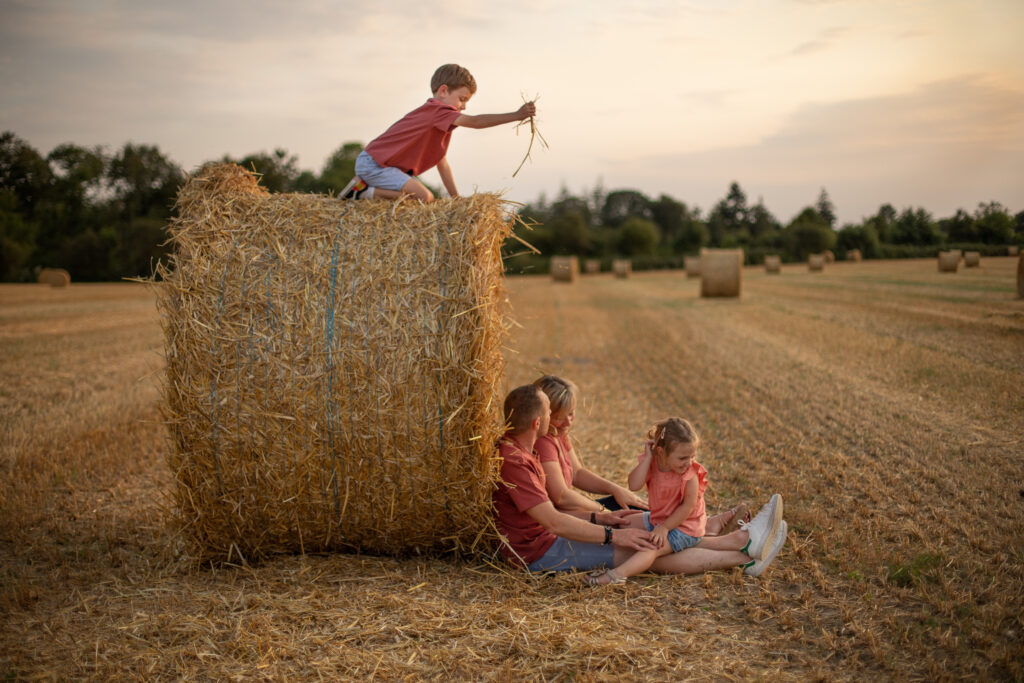
A travers une séance photo en famille, venez vivre un temps de partage en dehors du quotidien et des souvenirs inoubliables
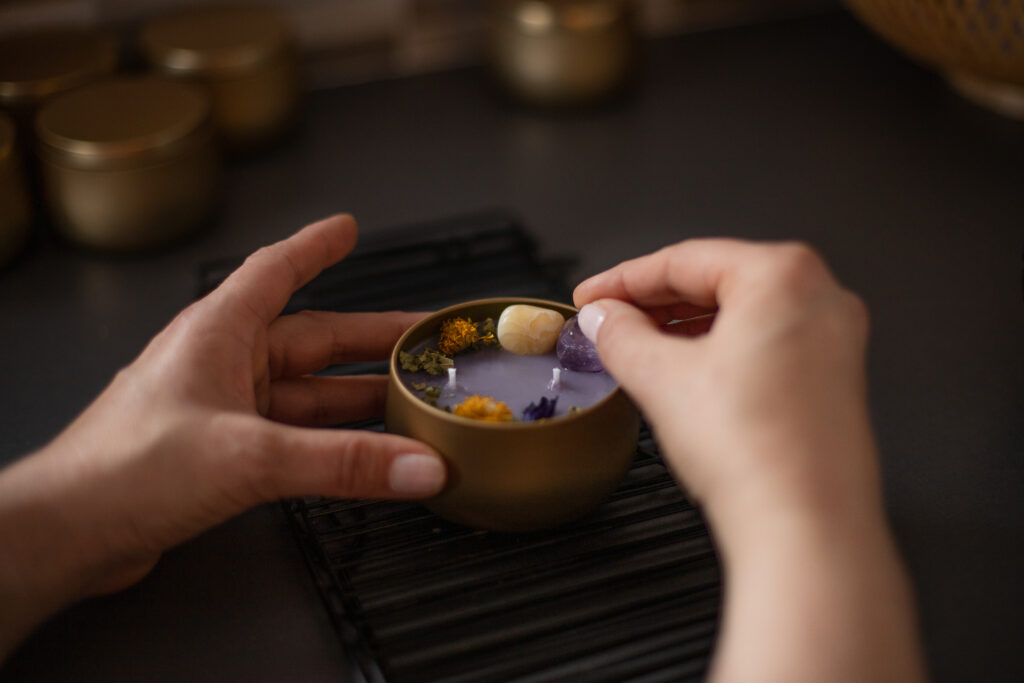
Je vous accompagne à travers un reportage photo pour mettre en valeur votre savoir faire, qu’il soit technique ou artistique.
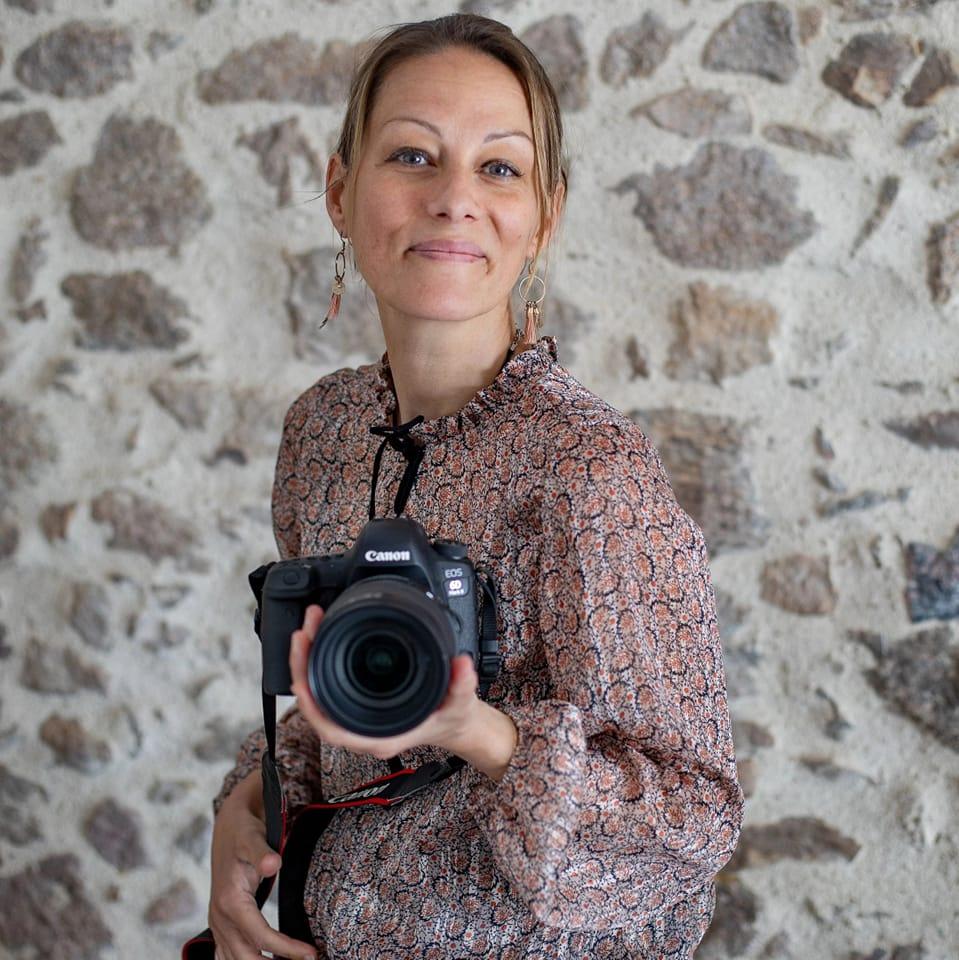
Emmanuelle gauthier
PHOTOGRAPHE PROFESSIONNELLE EN VENDEE
Mais qui se cache derrière Em’otion Photo ?
C’est moi Emmanuelle ! Ce n’est pas un hasard si j’ai choisi de donner ce nom à mon entreprise de photographie en Vendée : s’y entrelacent les premières lettres de mon prénom et le mot qui me caractérise probablement le plus : émotion.
Les émotions me fascinent, l’humain me passionne et les petits plaisirs simples de la vie m’enthousiasment ! C’est parce que j’aime voir les gens heureux que j’ai choisi de devenir photographe et de t’offrir des expériences photo uniques. Pour moi l’Humain est au coeur de mon travail et il est tout aussi important que les images que je vais te remettre à l’issue de ton expérience photo.
CE QU'ILS EN DISENT